Adventure in the Linux Kernel
When I started debugging this issue, I had no idea how far down the rabbithole would go!
A few months ago, I was writing an end-to-end test for the Nextcloud integration with OnlyOffice under NixOS, to be run in a QEMU virtual machine. Curiously, my test suffered from corrupt reads from a host folder that was mounted into the VM. That was the start of a journey that led me deep into the Linux Kernel.
The circumstances under which the problem occured were very specific: a certain file, read from a host folder that was mounted into the VM, would consistently be corrupt. Specifically, this was a 12943-byte file, which inside of the VM would also be 12943 bytes, but only the first 0x3000 bytes were populated: the rest was filled with zeroes. At this point I was convinced it likely only affected a very limited set of users – but I was determined to get to the bottom of it.
Plan9
Mounting a directory from the host filesystem into a QEMU VM typically happens by passing something like -virtfs local,path=/nix/store to the qemu startup command. This tells QEMU to start a small server exposing the Plan 9 filesystem protocol (P9). The kernel ‘inside’ the VM can then use the 9P_FS kernel module to mount the directory over this protocol.
Adding some tracing options to QEMU:
virtualisation.qemu.options = [
  "-trace 'v9fs*'"
];
… I could observe that, whenever I read the file, this read would be split over two v9fs_read calls: one of 0x3000 bytes, and one of 655. The data from the second call was somehow ‘going missing’. Was the QEMU server serving an empty block, or was P9_FS inside the VM dropping them?
Patching for diagnostics
To get more insight into what was going on on the Linux Kernel side, I configured the system-under-test to log the first byte of each read:
boot.kernelPatches = [ {
  name = "enable p9 debugging";
  patch = ./kernel-rread.patch;
  extraConfig = ''
    NET_9P_DEBUG y
  '';
} ];

boot.extraModprobeConfig = ''
  # ERROR+9P+VFS+CACHE=1+4+8+8192=8205
  options 9pnet debug=8205
'';
--- a/net/9p/client.c
+++ b/net/9p/client.c
@@ -1599,7 +1599,7 @@ p9_client_read_once(struct p9_fid *fid, u64 offset, struct iov_iter *to,
    return 0;
  }

+ p9_debug(P9_DEBUG_9P, "<<< RREAD count %u, %02x\n", received, *dataptr);

  if (non_zc) {
    int n = copy_to_iter(dataptr, received, to);
Sure enough, I saw the 2 RREAD calls on the linux kernel logs as well, and the expected character showed up at the start of the second read.
Reading the code
Poring over the kernel source code, one thing that stood out was that the 9p client would use ‘zerocopy’ APIs for regular reads, but not for small requests:
/* Don't bother zerocopy for small IO (< 1024) */
if (clnt->trans_mod->zc_request && rsize > 1024) {
  /* response header len is 11
   * PDU Header(7) + IO Size (4)
   */
  req = p9_client_zc_rpc(clnt, P9_TREAD, to, NULL, rsize,
0, 11, "dqd", fid->fid,
offset, rsize);
} else {
  non_zc = true;
  req = p9_client_rpc(clnt, P9_TREAD, "dqd", fid->fid, offset,
rsize);
}
Sure enough, the initial 0x3000 read would be a ‘zerocopy’ read, while the second 655-byte read would be small enough to use a ‘regular’ read. Perhaps these APIs were incompatible? It didn’t seem that way – but some experiments with patches did confirm that always using zerocopy made the problem go away. It was clear that I wasn’t going to get closer to the root cause without better visibility into what was actually going on.
Would it be able to attach a debugger to the running kernel?
It seemed plausible: QEMU has facilities for attaching gdb, and sure enough I could:
virtualisation.qemu.options = [
  "-trace 'v9fs*'"
  # open gdbserver on TCP port 1234
  "-s"
];
While gdb successfully attached, it was… pretty much useless, since the running kernel was the compressed bzImage that does not include any debugging symbols. After some digging I found out Nix also ships a vmlinux that does have debugging symbols in the kernel.dev output – promising, but even with that I saw nothing but gibberish.
WHY2025
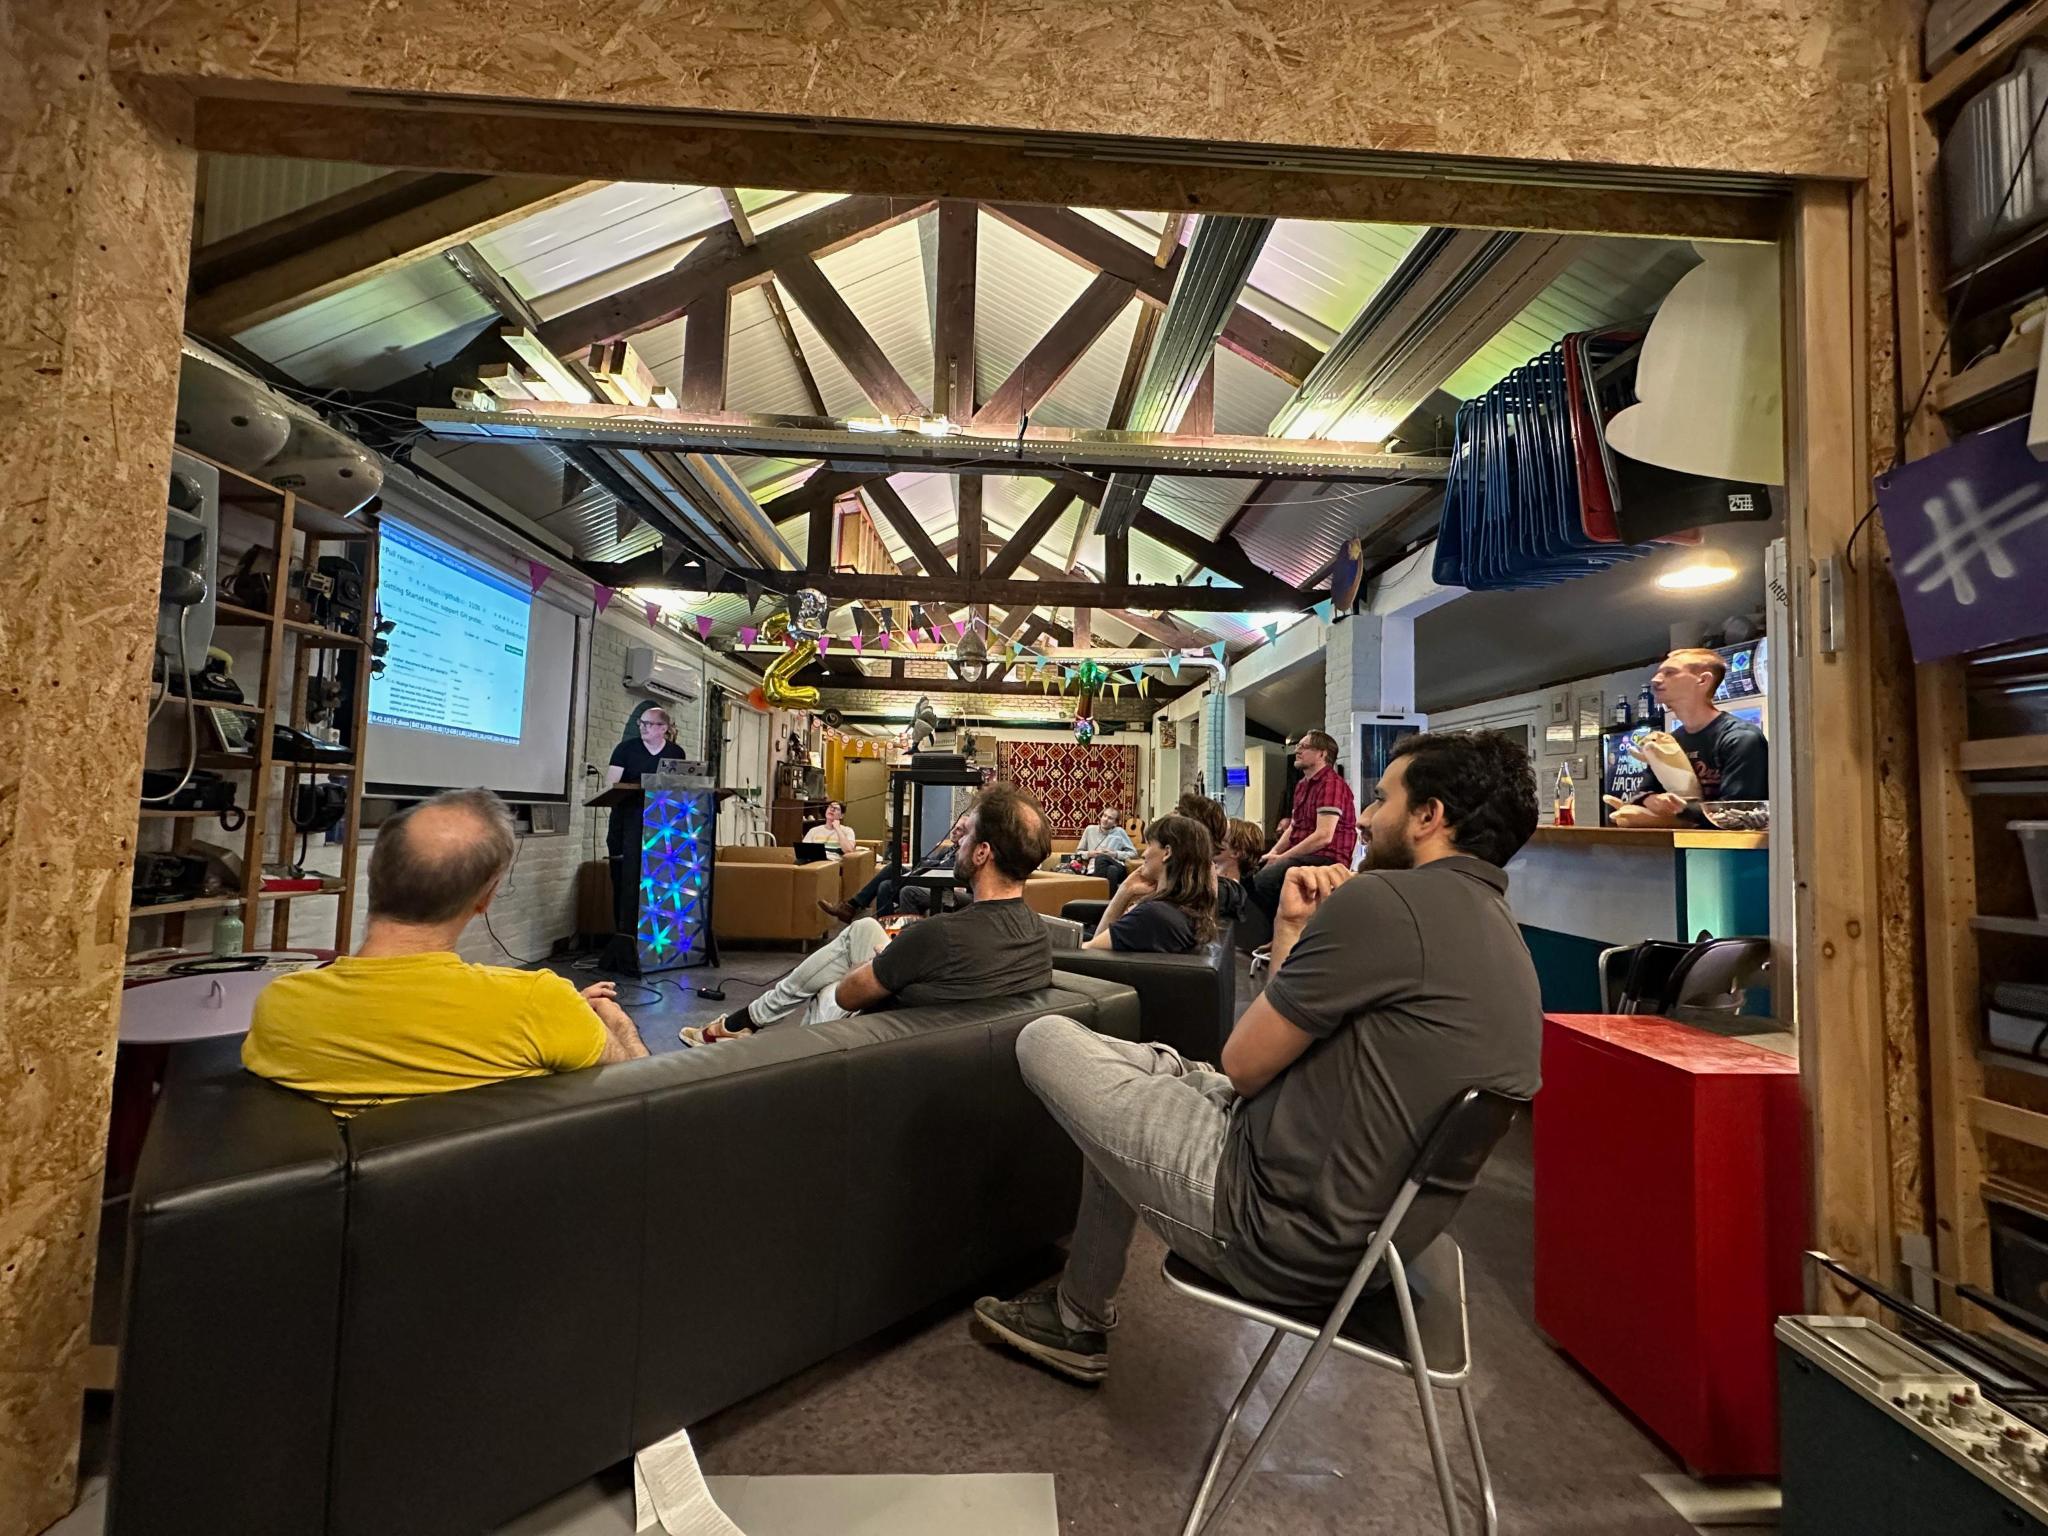
With this challenge top-of-mind I joined the Dutch hacker camp WHY2025, a great place to meet interesting people. I camped out at the Nix village:
There I bumped into Raito who pointed me to a thread on the kernel ‘regressions’ mailinglist where several people were running into a suspiciously-similar problem.
Debugging Symbols
Encouraged by the fact that the impact might be wider than I originally thought, I continued figuring out how to attach a debugger to the guest kernel. One obvious-in-hindsight piece of the puzzle was that I had to disable kernel Address Space Layout Randomization:
boot.kernelParams = [
  "nokaslr"
];
With that, I could set breakpoints and see reasonable backtraces!
Sadly, I could still not set breakpoints in 9p methods. Something extra was needed to support debugging code that’s in a kernel module – it turns out, a considerable side quest.
Module Debugging Symbols
While the command-line interface to gdb may look simple, looks can be deceiving: it’s a powerful tool. It even supports a plug-in architecture, and the Linux kernel comes with a gdb plugin for loading symbols for kernel modules written in Python.
This did require avoiding stripping the modules:
boot.kernelPackages = pkgs.linuxPackagesFor (pkgs.linux.overrideAttrs(a: {
  dontStrip = true;
}));
Also, part of the gdb plugin code is generated during the kernel build process, but the Nix packaging of the Linux kernel didn’t expose this yet. I patched the packaging to make this part of the dev output:
--- a/pkgs/os-specific/linux/kernel/manual-config.nix
+++ b/pkgs/os-specific/linux/kernel/manual-config.nix
@@ -325,6 +325,7 @@ lib.makeOverridable (
  "KBUILD_BUILD_VERSION=1-NixOS"
  kernelConf.target
  "vmlinux" # for "perf" and things like that
+ "scripts_gdb"
  ]
  ++ optional isModular "modules"
  ++ optionals buildDTBs [
@@ -432,6 +433,10 @@ lib.makeOverridable (
  postInstall = optionalString isModular ''
  mkdir -p $dev
  cp vmlinux $dev/
+
+ mkdir -p $dev/lib/modules/${modDirVersion}/build/scripts
+ cp -rL ../scripts/gdb/ $dev/lib/modules/${modDirVersion}/build/scripts
+
  if [ -z "''${dontStrip-}" ]; then
    installFlagsArray+=("INSTALL_MOD_STRIP=1")
  fi
Combined with just the right version of the Linux kernel sources (courtesy of pkgs.srcOnly), I could now fully debug the running kernel, including setting breakpoints and inspecting the local variables inside kernel modules.
Folio memory pages
Armed with this looking glass into the running kernel, I could now further inspect the (zerocopy and regular) calls dealing with the data read from the 9P protocol into the user buffers. With the help of some great articles on LWN I deciphered how the data was stored as a folio (basically, a structure of multiple memory regions that together form one ’logical’ region) with iov_iter structures pointing into those pages and coordinating operations on them.
Especially interesting was the observation that, after the first read, the folio was exactly 0x3000 (actually: three pages of 0x1000) in size. When the second p9 read happened, the folio would be ‘grown’ to make room for the additional 655 bytes and then the new data would be copied into it.
However, iov_iter is basically a ‘cursor’ into the folio. When the folio is exactly three 0x1000 segments, and the cursor is ‘at 0x3000’, where do you put it? There is no ‘fourth segment’ that you can put it on the beginning of, so apparently it is placed in the third segment, one byte past its last one. This is what confused the subsequent non-zerocopy read – and led to the problem of the bytes going ‘missing’.
Bringing in the big guns
With the problem pinned down like this, I felt comfortable sharing my findings on the regressions list. What’s more, I could share not only my description of the situation, but an actually-working Nix configuration demonstrating it. With that, 9P_FS maintainer Dominique Martinet could reproduce the issue within hours
this is a huge leap forward (hopeful it’s the same problem and we don’t have two similar issues lurking here…), we can’t thank you enough.
… and when I woke up to a beautiful sunny WHY2025 morning I found his preliminary patch in my inbox:
So that wasn’t a 9p bug, I’m not sure if I should be happy or not?
I’ve sent “proper-ish” patches at [1]
It’s taken some more reviews and iterations, but the fix is now making its way into various kernel releases.
Conclusion
What looked like a bug in an obscure corner of QEMU turned out to be a bug in the Linux Kernel Memory subsystem that, had we not found it, may have caused countless hard-to-diagnose issues in the future.
Big thanks to the NGI Fediversity programme, that saw the value of putting time into this lower-level issue and allowed me to dedicate part of the Source-based Nextcloud and OnlyOffice budget towards figuring this out – otherwise I might not have been able to justify the effort.
A lot of the work went into figuring out how exactly to put the various tools together to achieve the right diagnostic environment. With the scripts_gdb patch now merged and the required configuration documented as a working NixOS configuration, this should easy to set up from now on!
This article also appeared on my personal blog at https://arnout.engelen.eu/blog/linux-kernel-adventure/


